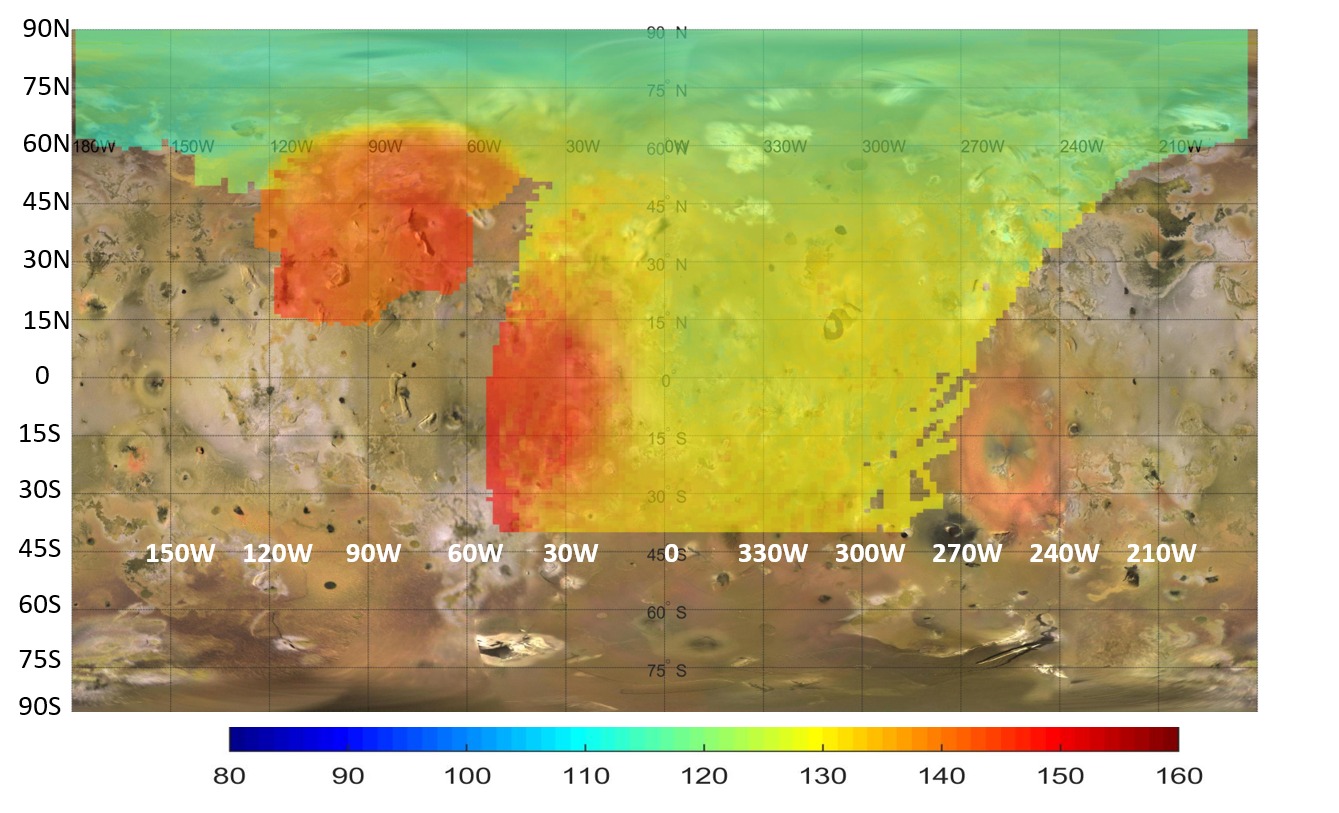
NASA map wey come out on July 22 show how Juno spacecraft investigate heat under the surface of Jupiter moon Io. This archive analysis concern microwave observations. Dem examine another layer from infrared instruments, wey measure temperature for the ground surface itself.
Juno Microwave Radiometer use low-frequency channels of 0.6 and 1.25 gigahertz. NASA say these measurements fit reach about two to six metres inside the crust. The map come from radiation measurements; no be photograph wey make ground transparent so we fit see buried rock.
One strong warm area dey between about 60 and 120 degrees west longitude. Temperature under ground there pass surrounding areas by about 10 to 20 Celsius degrees. Na difference between temperatures; e no mean say the whole place get temperature of 10 to 20 degrees Celsius.
This warm area match Zal Montes Patera complex, where another Juno instrument see active lava flow. Another big heat source appear near equator, between about zero and 50 degrees west longitude. The two areas support evidence of strong internal heating for particular places.
The map join observations from close passes on December 30, 2023, and February 3, 2024. Their coverage overlap because Juno rotate two times each minute as e pass roughly 1,500 kilometres above Io. Both passes measure the side wey always face Jupiter.
The colours make temperature differences easier to compare, but readers need understand say na scientific scale. These measurements add information about depth to Io volcano story. Dem separate warm areas under ground from cooler surroundings instead of assuming every bright surface feature represent the same heat source.